![[pta7] Disertatie '10](http://3.bp.blogspot.com/_ZDn6mcKZQHc/S4H5N3koXKI/AAAAAAAAASU/z1BBmWzQeLc/S1600-R/Massive+Change004small+copy.jpg)
Ce sunt infograficele si cum ar trebuii facute acestea?

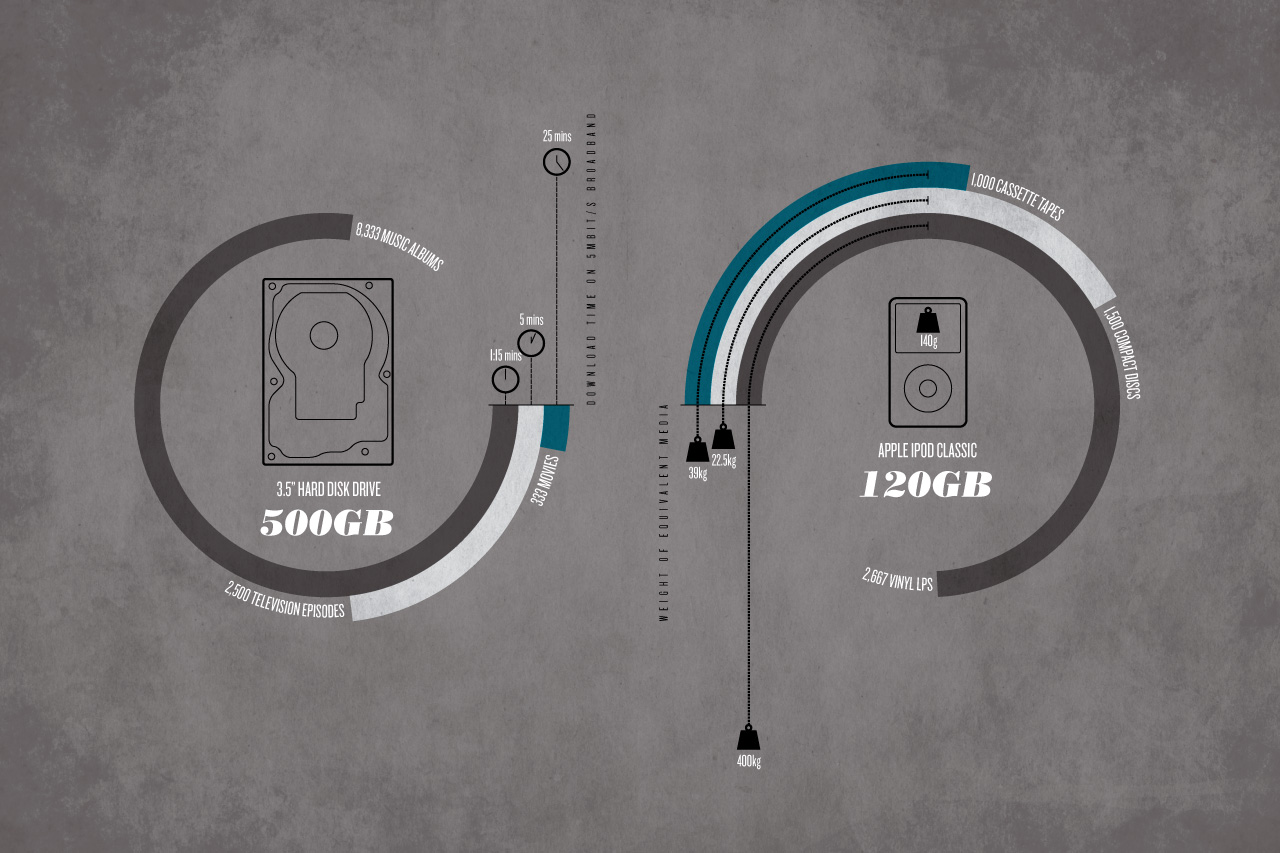
Information graphics, or infographics, are visual representations of information, data or knowledge. The graphics are used where complex information needs to be explained quickly and clearly, such as on signs and maps and in journalism, technical writing and education. Today, infographics surround us in the media, in published works both mainstream and scientific and in road signs and manuals. They illustrate information that would be unwieldy in text form and act as a visual shorthand for everyday concepts, such as “Stop” and “Go.”
Creating an effective infographic requires both artistic sense and a clear vision of what to tell the audience. The following are some cool infographics we have collected. Some are colorful, some are simple, but all are informative and visually pleasing. Not only do they provide information in a format that is easy to understand, but they are also artistic creations in their own right.
LINK: INFOgraphics and DATA Visualization
aaaaaaa...ador infographics astea, long time passion!!!
ReplyDeletesursa mea preferata: http://infosthetics.com/ (when form follows data)
;)
enjoy!
Will put this link/your blog into the next update of my statistical graphics resource list. Check out the Data Visualisation References resource list! (http://crisismaven.wordpress.com/references/references-subjects-covered/data-structuring/data-visualisation-references/)
ReplyDeleteMie-mi placeau si graficele alea clasice. Dar astea? Pe astea le iubesc! Cand le-am vazut prima oara am simtit ca am mai invatat un alfabet. Let's talk! :)
ReplyDelete